
Investment Strategies
In keeping with MCF's position as one of the largest community foundations in the country, we offer world-class investment strategies. Our approach reflects the evolving needs of our donors and the marketplace and provides opportunities for donors to invest in values-aligned companies and engage in impact investing.
Developed in conjunction with our investment advisor Cambridge Associates, the strategies provide donors with the flexibility to meet their grantmaking objectives given different time horizons and varying tolerance for market fluctuations.
Consistent with our longstanding approach, the strategies offer regular liquidity to fund donor grantmaking.[1]
Cornerstone Strategy
The Cornerstone Strategy, MCF’s flagship, is invested for long-term growth and appreciation. It seeks to preserve purchasing power and provide real growth of assets over an indefinite time horizon, while funding annual donor grantmaking.
Best Fit For
The Cornerstone Strategy is appropriate for most MCF donors as it seeks to deliver long-term growth in excess of annual grant distributions. It is also the strategy for permanent endowments.
Grantmaking Horizon
2 or more years.
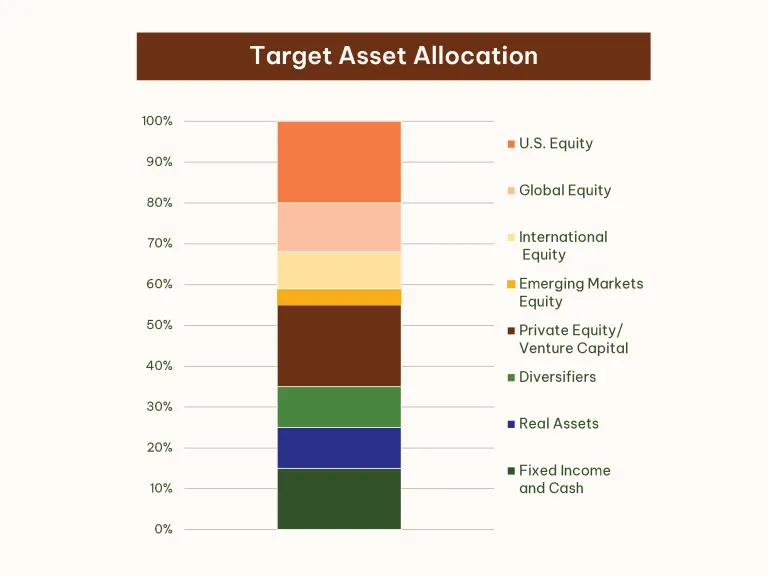
Asset Allocation
The portfolio is invested in a well-diversified mix of public and private equity to generate growth, alternative strategies and real assets that help provide diversification and reduce market volatility, fixed income and cash. The allocation reflects the long-term targets after private investment exposure is built out over multiple years (to help ensure appropriate diversification); during the build-out period, public equity allocations will be above long-term targets, and private equity and venture capital allocations will be below long-term targets.
Observations
The Cornerstone Strategy has the highest return potential and the best probability of maintaining value after inflation and annual grantmaking over the long term. It is intended to offer risk-return in line with a portfolio that is 70% equity and 30% fixed income, while also providing exposure to active strategies with high potential value add and private investments. There is a high probability of short-term declines given the equity orientation. The estimated expense ratio is 0.80-0.90% for the interim allocation and will increase as private exposure is built out.[2]
North Star Strategy
The North Star Strategy is invested for long-term growth and appreciation using a sustainability lens. It seeks to preserve purchasing power and provide real growth of assets over an indefinite time horizon, while funding annual donor grantmaking.
Best Fit For
The North Star Strategy is appropriate for donors who place a priority on values-aligned investing and approach grantmaking with a multi-year horizon.
Grantmaking Horizon
2 or more years.
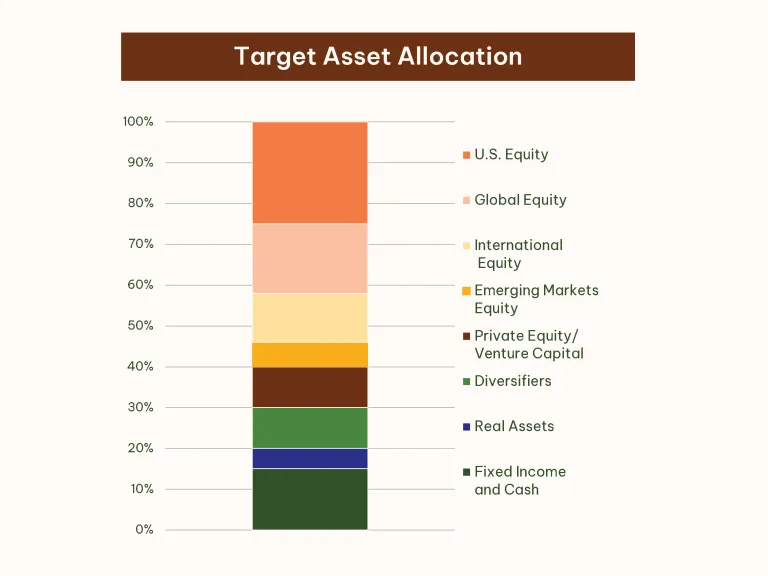
Asset Allocation
The strategy is invested in a well-diversified mix of public and private equity to generate growth, alternative strategies and selected real assets that help provide diversification and reduce market volatility, fixed income and cash. Private investments are anticipated as the strategy is built out; these exposures will develop over multiple years to help ensure appropriate diversification.
Observations
The North Star Strategy will have a focus on fund managers with values-aligned objectives, potentially including sustainable energy, infrastructure and transport, affordable housing, education and workforce development, and health and wellness. It is intended to offer risk-return in line with a portfolio that is 70% equity and 30% fixed income, while also providing exposure to selected public active strategies with high potential value add as well as private investments. There is a high probability of short-term declines given the equity orientation. The estimated expense ratio is 0.70-0.75%.[3]
Short Term Strategy
The Short-Term Strategy is intended to preserve principal and provide liquidity.
Best Fit For
The Short-Term Strategy is appropriate for donors who seek to avoid market volatility and expect to make significant grants in the short term.
Grantmaking Horizon
Up to 2 years.
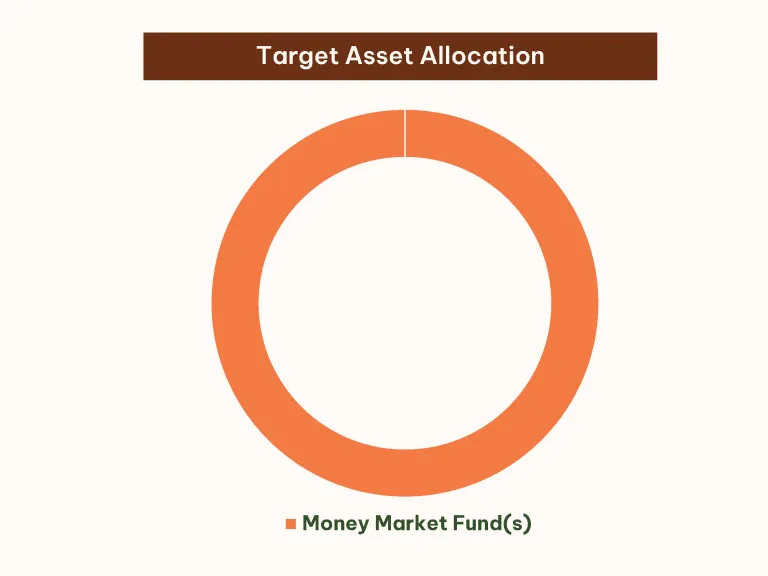
Asset Allocation
The strategy is invested in money market funds or similar structures with attention to high liquidity, high quality and low fees.
Observations
The Short-Term Strategy is expected to generate modest current income and should exhibit low volatility. The estimated expense ratio is 0.30%.
Balanced Strategy
The Balanced Strategy is invested to strike an equilibrium between growth and stability.
Best Fit For
The Balanced Strategy is appropriate for donors who have lower tolerance for market fluctuations and approach grantmaking with a multi-year horizon.
Grantmaking Horizon
2 or more years.
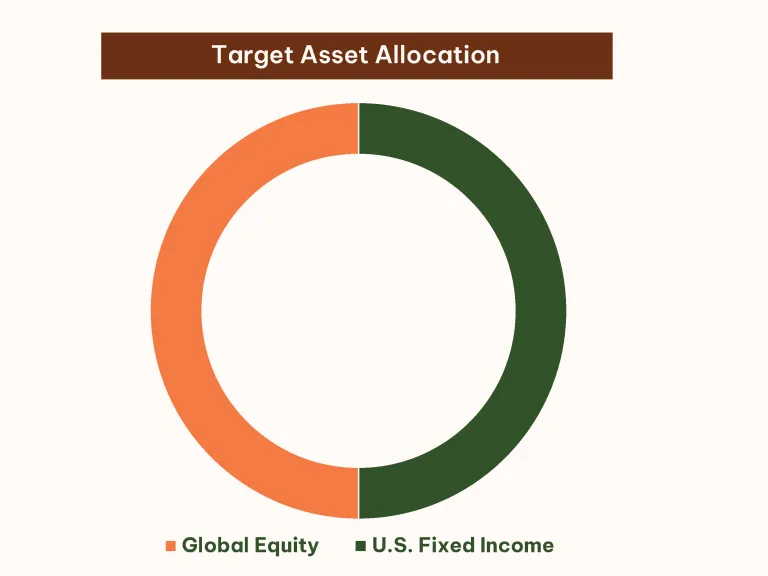
Asset Allocation
The strategy seeks to balance growth and stability by investing one-half of assets in a passive global equity index and one-half in a passive fixed income index. Regular monthly rebalancing to maintain the 50:50 split will be facilitated through use of mutual funds or exchange-traded funds (ETFs).
Observations
The Balanced Strategy is designed to capture some market growth with less volatility and is expected to deliver lower returns over time than the Cornerstone or North Star Strategies. There is a high probability of short-term declines given the equity exposure. The estimated expense ratio is 0.15-0.20%.
CommunityFirst Loan Strategy
The CommunityFirst Strategy is a loan fund that provides relatively low-cost loans to nonprofit organizations within Marin County which may not be able to access or afford traditional commercial debt.
The Strategy is intended to increase access to affordable housing, clean energy, social supports, and thriving nonprofits while seeking to deliver a 2% annual return to investors.
Best Fit For
The CommunityFirst Strategy is an appropriate complement to donors’ primary investment strategy. It is especially useful for donors who seek to align their investments with their values and community, and for those who place a priority on Marin County with a longer time horizon.
Grantmaking Horizon
Flexible, but multi-year.
Asset Allocation
The Strategy is invested in loans to nonprofit organizations within Marin County.
Observations
The CommunityFirst Strategy is a longstanding MCF investment offering and has had no loan losses over the last 20 years. The Strategy enables participants to engage directly in local impact investing initiatives, including projects such as affordable housing. The underlying loans are issued at below-market interest rates, catalyzing projects that would not otherwise happen.
Because liquidity is tied to borrower repayment schedules, redemption requests by donors may take up to one year to be fulfilled. The Strategy is administered by MCF, which does not charge a management fee.
To download these investment strategies, along with accompanying notes and performance benchmarks, please click here.
Notes
The estimated expense ratio includes management fees charged by the underlying funds, the Cambridge Associates advisory fee and estimated MCF expenses. The MCF administrative fee is charged separately, based on a fee schedule that is available on the website at marincf.org. Historical returns are through December 31, 2025. The 70% Global Equities Index/30% Aggregate Bonds Index is included for reference purposes. Global equities is represented by the MSCI ACWI Index, and fixed income by the Bloomberg Barclays Aggregate Bond Index. PAST PERFORMANCE IS NOT INDICATIVE OF FUTURE RESULTS.
[1] The CommunityFirst Strategy, with its focus on making loans to local non-profits, will have a more limited liquidity schedule. See details in the CommunityFirst Strategy summary.
[2] Estimate is net of approximately 0.07% of fee reductions negotiated by Cambridge Associates. Excludes incentive fees that may be earned based on investment performance. Private investments, that typically charge higher manager fees, are assumed to increase over time and will increase the expense ratio.
[3] Estimate is net of approximately 0.05% of fee reductions negotiated by Cambridge Associates. Excludes incentive fees that may be earned based on investment performance. Private investments, that typically charge higher fees, are assumed to increase over time and will increase the expense ratio
Investment Committee
MCF's Investment Committee, made up of volunteer professionals in the investment industry, guides the investment strategies of the Foundation. Click on the link to meet the impressive team.